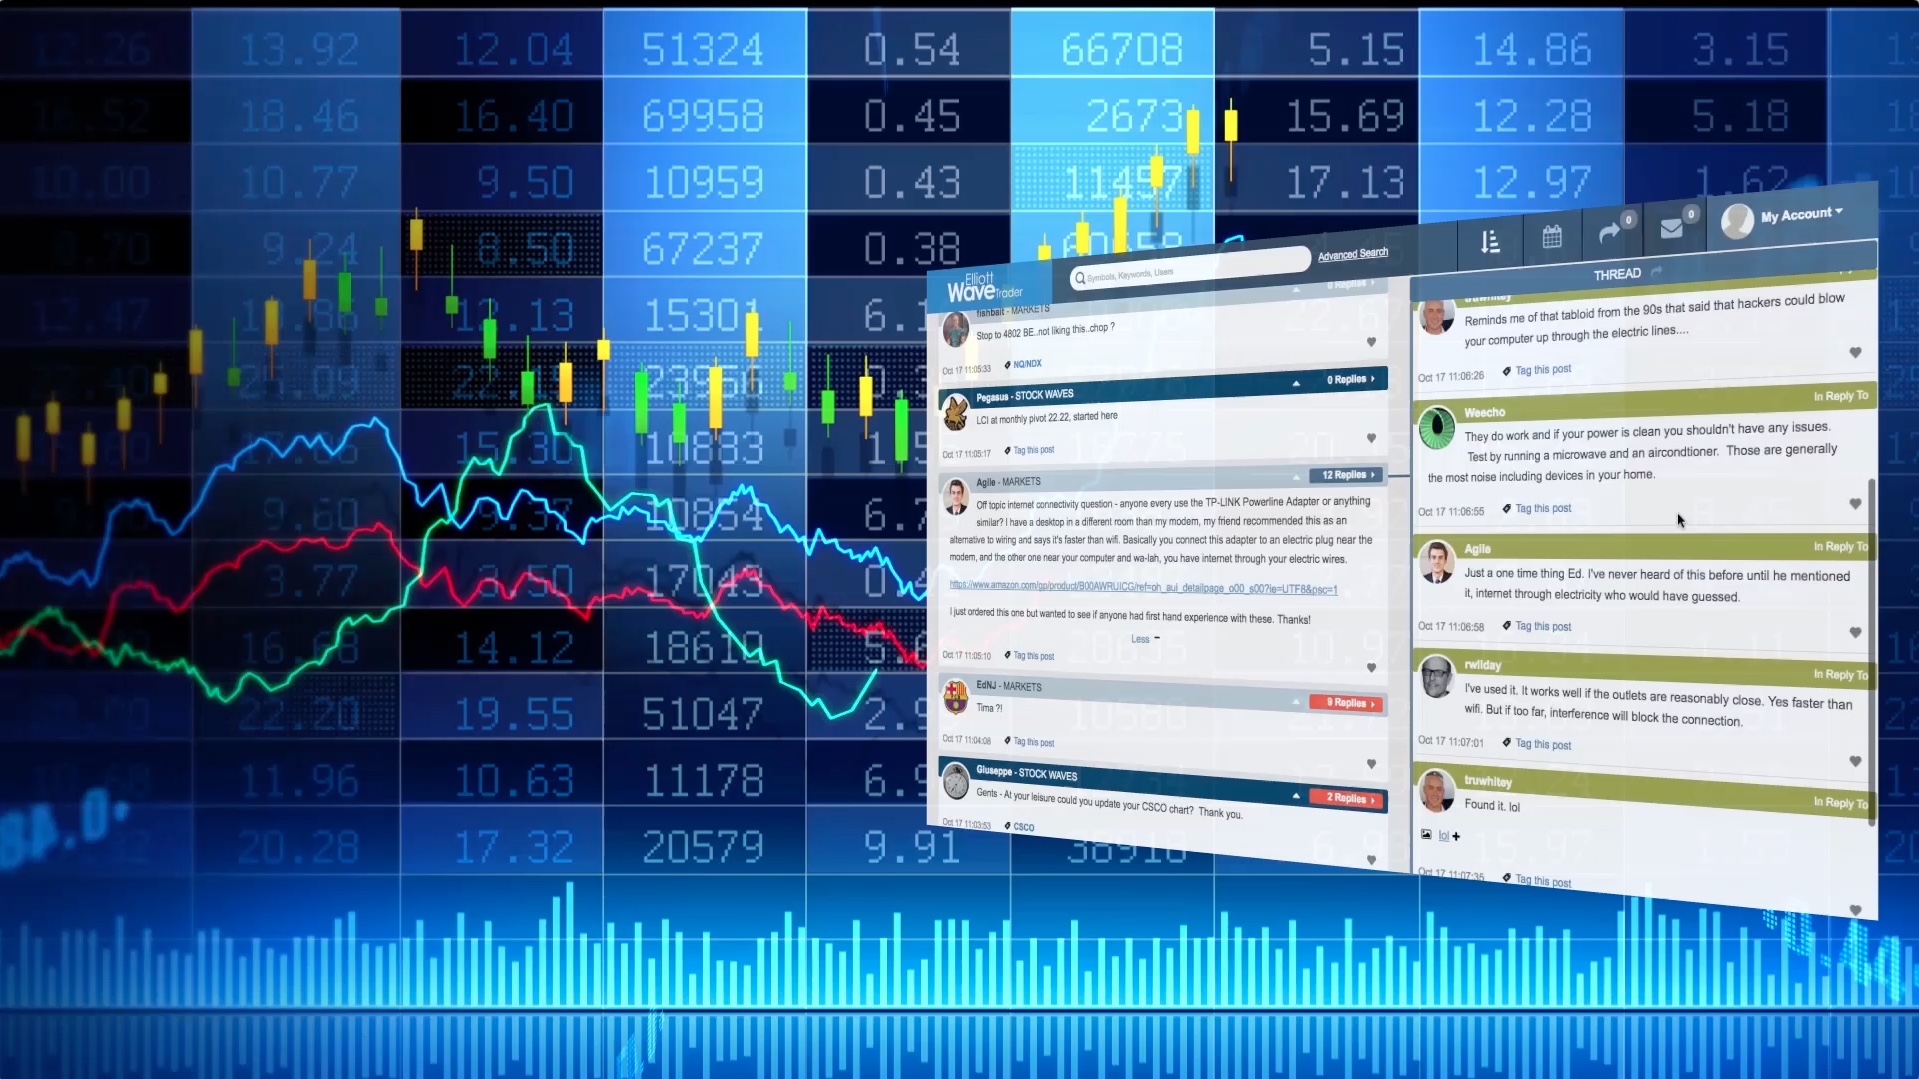
Our Live Trading Rooms Bring Together Thousands of Traders from Around the World!
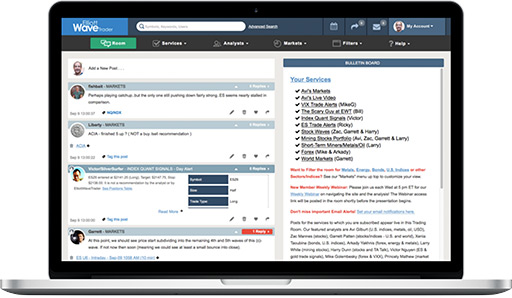
Learn MoreES is reacting negatively to the Q1 growth and price data, which has pressed ES to a low of 5048.50 so far, which we see on my attached Hourly Chart is approaching my optimal next lower target window at 5040/50, from where my pattern work identifies as the next lower zone from where a recovery rally could emerge... Last is 5051.00...
As of tonight, I would say that not only do we have enough waves in place to consider a bottom to having been struck in this recent pullback in metals, but we even have an argument for the start of the next rally in place. Yet, I have to admit it is not the clearest of 5 waves up, and it is really of a very small wave degree, so much so that I cannot say that I am prepared to view this as a high probability just yet.
Today the market opened sharply lower only to see a fairly sharp reversal in the afternoon session. The case could be made that the reversal up off of the lows is a micro five wave move which is what we would need to see to suggest we are going to push higher in the wave (c) of the larger wave b per the purple count on the charts. As long as we can hold over micro support we still have the setup in place to push higher to finish off the larger wave b before turning down once again.
Our Technical Analysts Share Their Expertise 24/7 on a Vast Range of Markets!
Learn More
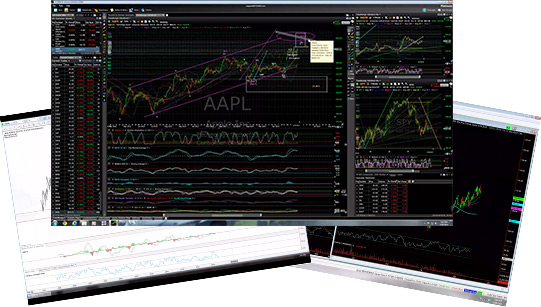
Our Free Educational Presentations & Articles Reach Audiences Across Scores of Sites!
Learn More